
The real estate market since the start of the COVID-19 pandemic has been tough on all buyers, but aspiring first-time buyers may have struggled most of all.
For much of 2020 and 2021, the housing market faced a challenging combination of high demand and low supply. Young people were already growing into the largest segment of buyers as the Millennial generation came of age. When the COVID-19 pandemic hit, preferences for more living space, increased remote work opportunities, and other factors related to the pandemic encouraged even more people to enter the market. But existing owners proved reluctant to part with their homes, with supply on the market reaching a record low late in 2020. As a result, competition in the market drove the median home price up by 36% over the last two years. The run-up in home values was good news for people who already had equity in their homes, but it pushed prices out of reach for first-time buyers.
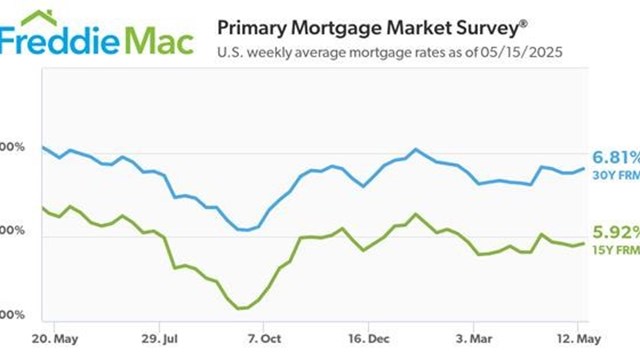
More recently, persistent inflation—and policymakers’ responses to it—have also made it harder to save up for a home. The prices of household essentials like groceries, energy, and especially rent have grown quickly over the last 18 months, leaving first-time buyers with less money to set aside. And now, as the U.S. Federal Reserve raises interest rates in efforts to combat inflation, the costs to take out a mortgage loan have risen dramatically. The average 30-year mortgage interest rate in the U.S. is more than double what it was at the start of 2022, translating into hundreds more dollars per month in payments for would-be buyers.
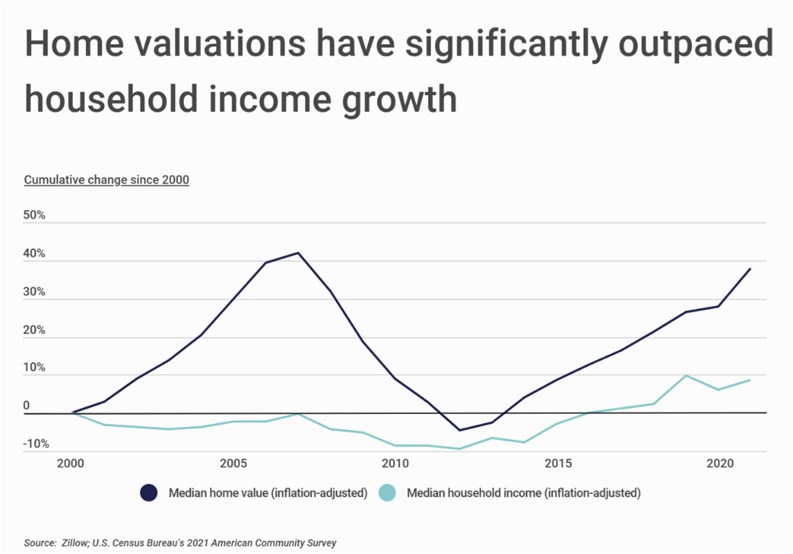
While recent trends in the market have been especially challenging, buyers have struggled with affordability for longer than that. One issue is that the rate of growth in home values has outpaced that of household incomes over the last 20 years after adjusting for inflation. From 2020 to 2021, median home values increased by 37.8%, while the median household income grew by just 8.78% over the same span.
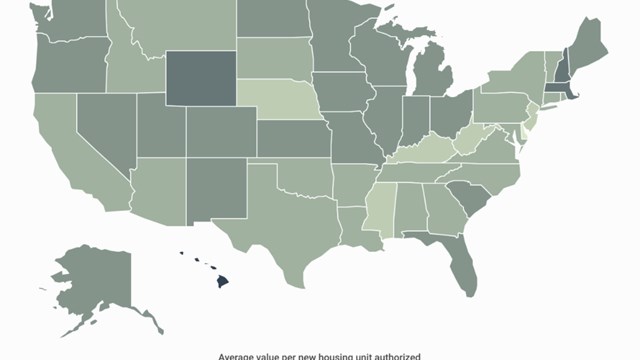
Supply has been another constraint for first-time homebuyers. The U.S. faces a shortage of housing overall, but builders are also building fewer of the smaller, more affordable homes they used to. Single-family one- or two-bedroom homes represented 24.1% of newly built homes in the mid-1980s, but just 6.2% today. Over the same span, the share of 4+ bedroom homes among new builds grew from 19.3% to 49.6%.
While conditions are challenging overall for new buyers, some parts of the U.S. are more favorable. Ideal markets for new buyers display a combination of adequate supply, a high share of smaller homes in the housing supply, relatively low sales prices for starter homes, and strong homeownership rates among young people. By these measures, West Virginia is the best state in the country to find a starter home, followed by Oklahoma and Mississippi. At the local level, Southern and Rust Belt cities lead the way.
The data used in this analysis is from the U.S. Census Bureau, Zillow, and Redfin. To determine the locations where you're most likely to find a starter home, researchers at Construction Coverage calculated a composite score based on the percentage of homes with three or fewer bedrooms, the median sale price of homes with three or fewer bedrooms, the months of supply of houses for sale, and the homeownership rate for householders under 35 years old. In the event of a tie, the location with the greater percentage of homes with three or fewer bedrooms was ranked higher.
Here is a summary of the data for the New York-Newark-Jersey City, NY-NJ-PA metro area:
- Composite score: 33.0
- Percentage of homes with ≤ 3 bedrooms: 66.2%
- Median sale price of homes with ≤ 3 bedrooms: $505,542
- Months supply: 2.8
- Homeownership rate for under-35 householders: 7.6%
For reference, here are the statistics for the entire United States:
- Composite score: N/A
- Percentage of homes with ≤ 3 bedrooms: 67.8%
- Median sale price of homes with ≤ 3 bedrooms: $309,496
- Months supply: 2.0
- Homeownership rate for under-35 householders: 10.7%
For more information, a detailed methodology, and complete results, you can find the original report on Construction Coverage’s website: https://constructioncoverage.com/research/the-best-cities-to-find-a-starter-home-2022


Leave a Comment